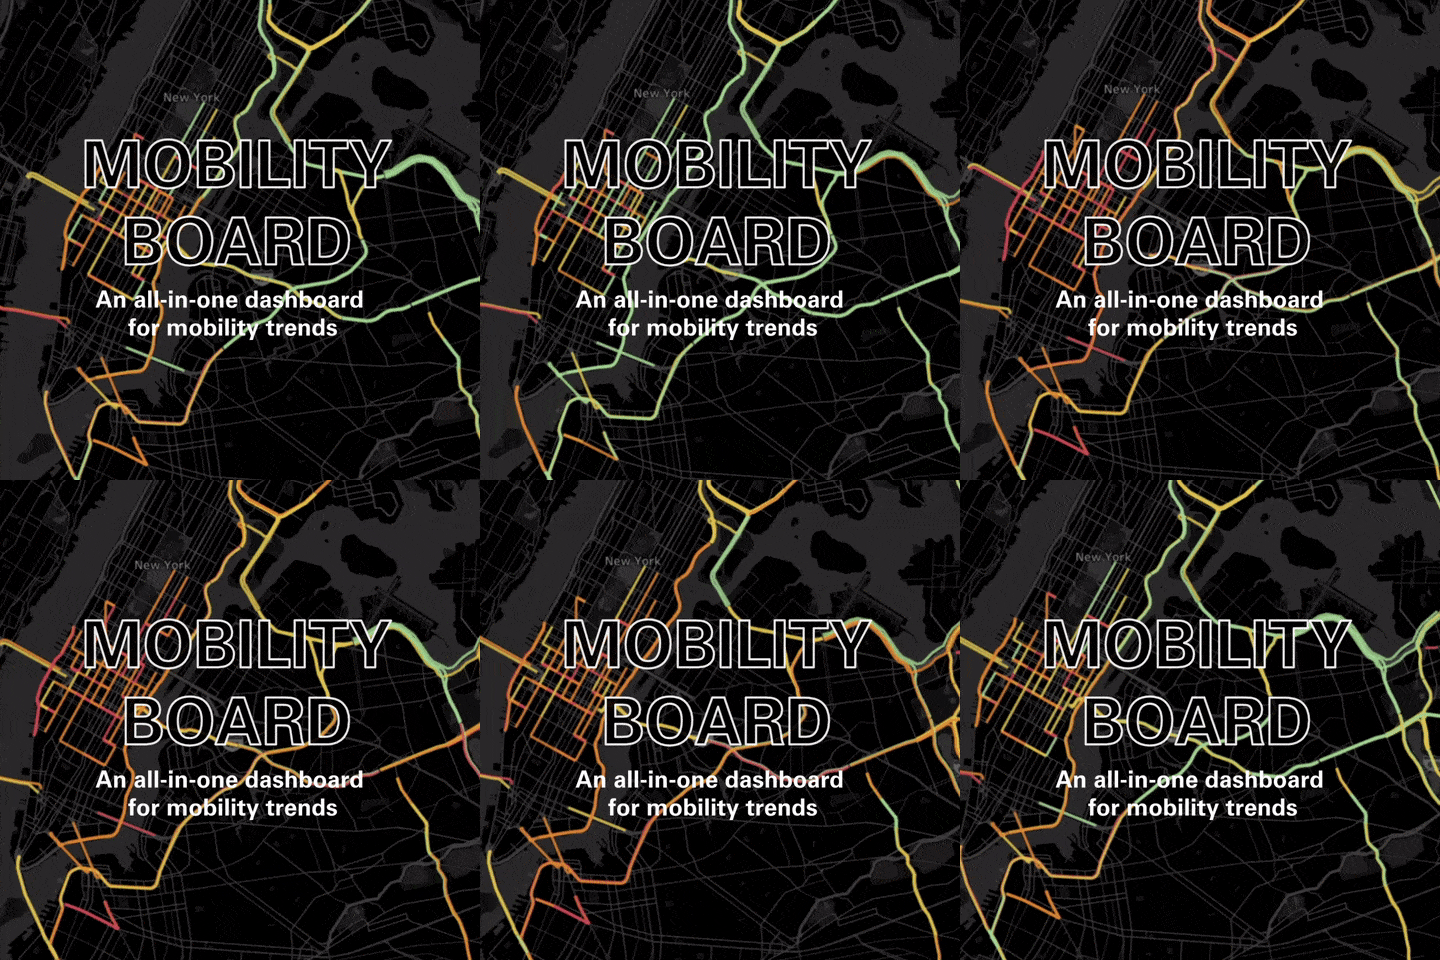
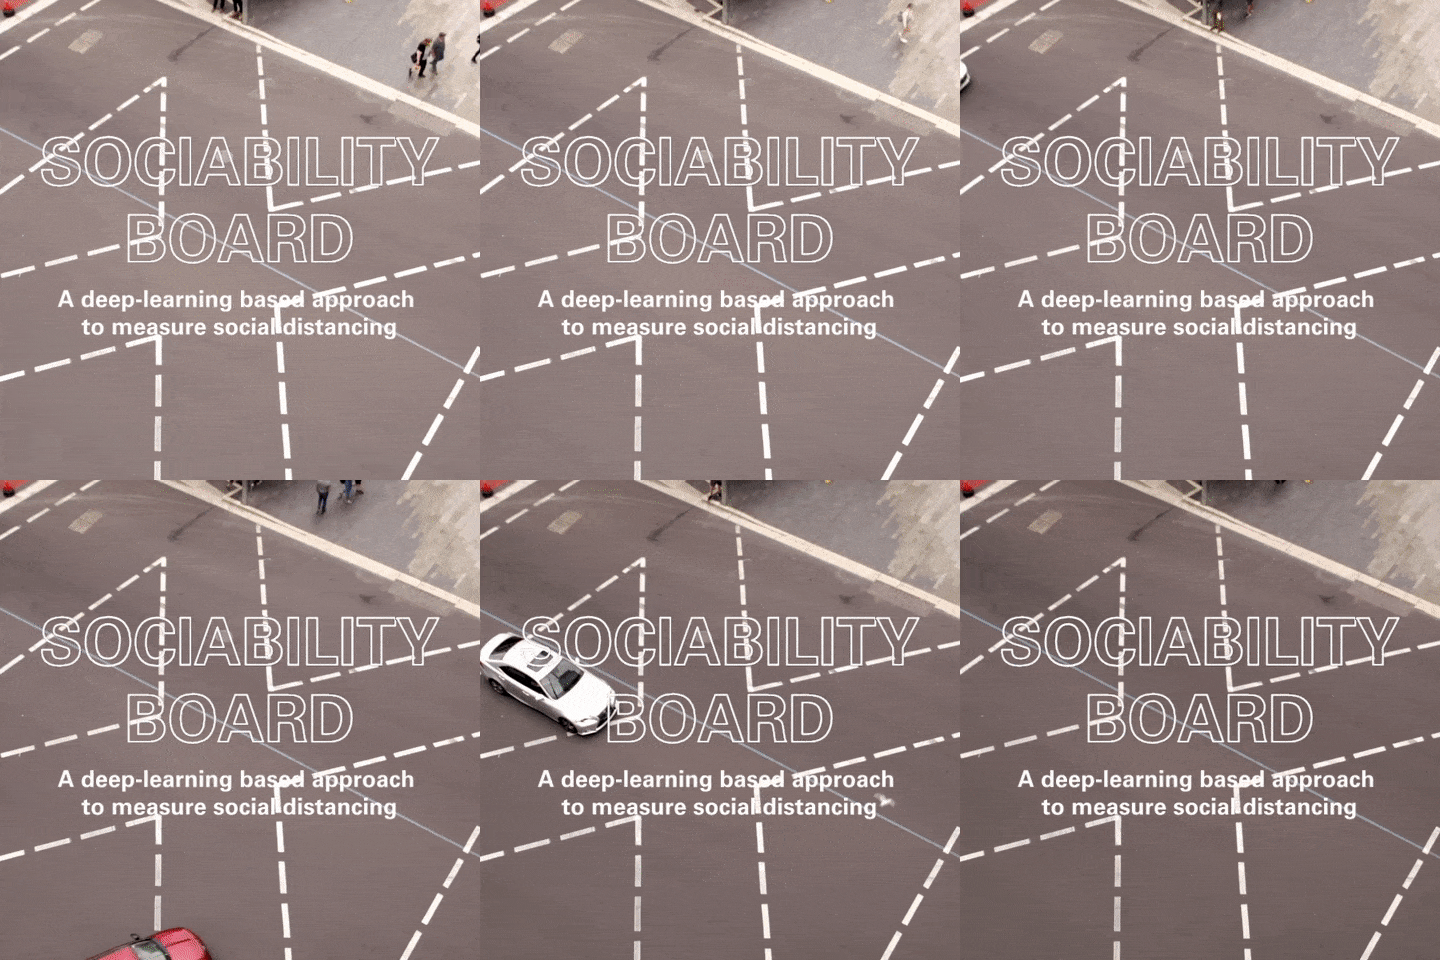
Welcome to the C2SMART COVID-19 Data Dashboard! This interactive data dashboard consolidates public data sources to track the mobility and sociability impact of the pandemic on transportation systems as it unfolds. This platform will update regularly and continue to evolve with the addition of new data, impact metrics, and visualizations.
Updates (For more information about the C2SMART COVID-19 Data Dashboard, please contact Jingqin Gao at: jingqin.gao@nyu.edu.):
- NEW! – The subway ridership from four cities in China has been updated (5/11/2021)
- NEW! – The yellow, green taxi and For-Hire Vehicle (FHV) trip-related data in 2020 has been updated
- NEW! – Monthly Vehicular Traffic at Port Authority Tunnels and Bridges has been added
- NEW! – Social Distancing Safety Rate and Temporal Distributions of Pedestrian, Car and Cyclist charts have been uploaded under “Sociability” Tab
- Most of the data and aggregated statistics will be updated weekly and are open for download


