

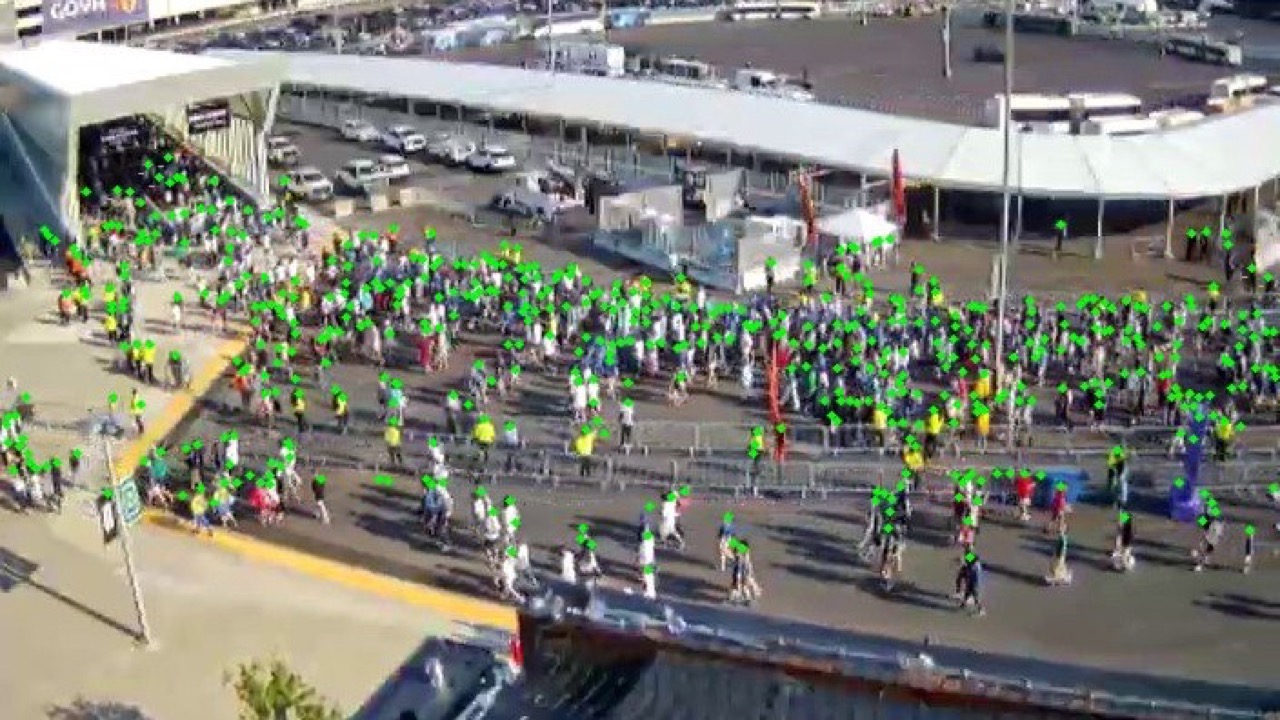
How do tens of thousands of fans move through the...
Read MoreThe Research Question
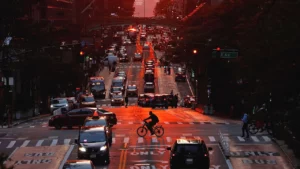
When Amazon announced that it was considering Long Island City, NY as a location for its second headquarters, it drew notable media attention, much of it centered around speculation of the impact that the ‘HQ2’, as seen in Fig 1 (right) would have on its local community. The addition of a major business hub could affect, or even disrupt, the functioning of systems, from food sales to the various layers of the transportation network.
To help understand the full potential effects of HQ2, researchers at C2SMART and the BUILT Lab created a ‘synthetic population’ to mirror the real-world population of New York City. A synthetic population is made up of digital people who possess attributes like age, race, income, where they live, where they work, how many kids they have, etc. When it is fully developed, the percentages in each category will be as close as possible to the real breakdowns. For example, if 30% of New York City is between the age of 18 and 35, then roughly 30% of the synthetic population will be

in that range as well. The strength of this tool is that each of those factors affect how people make decisions when they travel throughout the day, so the uniqueness of each individual can inform how they specifically would react to all the different options that are presented to them. By studying how the synthetic population would change with and without the HQ2, the BUILT team was able to describe what the hypothetical impacts would be.
The MATSim-NYC Model
At the end of each day, the model looks at the choices every traveler has made and updates them with the experiences the traveler actually had. For example, a driver who took a very congested route on day 1 will look for a different route on day 2, much like real-world drivers do. This process is repeated until the measured system improvements drop below a certain impact threshold. Researchers used this digital city as a testing ground to see what would happen if a hub like HQ2 was added to the system.
The projections from Amazon suggested that 25,000 new jobs would be added by the year 2028. It is likely that most but not all the Amazon jobs will fall under the category of “professional, scientific, and technical services (PSTS)” as defined by the North American Industry Code System. There would also be a knock-on effect of other service jobs such as restaurant employees being created in the area. The size and proportion of the other jobs are likely to be much smaller than bulk of the PSTS jobs though, and the estimation of their exact values is more of an economic endeavor than a transportation one, so the simplifying assumption was made to only consider the 25000 as PSTS jobs.

By comparing against expected total population growth in the year 2028 as well as how different industries are represented in the New York City job market, the team was able to estimate the number of workers that would naturally come from New York City (approx. 650) versus the number that would be added to the New York City area (approx. 23,500). Once the populations were calculated, they needed to be fleshed out in order to understand how these additions would impact the overall functioning of the city. Fig 6 (left) illustrates how each category of people will be assigned their traits.
One of the key insights from earlier MATSim-NYC work is that the idea that a traveler’s mode choice (private car vs bike vs transit vs etc.) is interdependent on the rest of their day. The complete set of trips a person makes throughout the day is called a tour, and tour-dependent mode choice modeling is made possible because of the principle of agent-based modeling. MATSim simulates each person and tracks them throughout their day, allowing for this more realistic approach to studying how people move across the city. For example, if a person takes public transit into work, they wouldn’t then be able to drive alone to lunch and back, because they don’t have their personal vehicle.
Another cutting-edge feature of this work is the incorporation of emerging types of mobility. Modes such as bike sharing with services like Citibike and for hire vehicles (FHV) with services like Uber and Lyft provide travelers with new options that previous models have not been able to capture. C2SMART’s researchers used these innovations in transportation modeling to simulate the full complexity – and, by extension, the full impact – of these 25,000 new agents, making and executing their commuting, shopping, and living choices every day.
The Impact Potential

Analysis of the simulation shows a staggering increase in the number of trips that would have been made to the Long Island City area had HQ2 been built. Table 7 (above) shows these numbers.
Comparing the year 2028 with the Amazon facility versus without shows the number of trips triple in six out of eight modes: driving, transit, taxi, biking, FHV, and bike-share. The total number of trips jumps from roughly 22,000 to roughly 72,000. Further analysis shows these changes broken down by Time of Day in the tables below.


In the scenario without HQ2, only one hour has greater than 5000 trips entering or leaving the area, but in the scenario with HQ2 there are six hours with greater than 6000 trips entering or leaving the area, with the peak hour being above 8000 trips. Had this project been approved, decision-makers in New York City would now have a much better idea of what type and scale of changes that would need to be made to the transportation infrastructure and policy to support this large increase in demand.
As always, the team concluded by making the products generated publicly available for local officials and other researchers to further study the outcomes of the projected by the model.
The Next Steps
To follow this transportation study to its conclusion, decision-makers in New York City could then presented the results of this study to an engineering firm which specializes in this type of project. That firm then could reach back to the BUILT lab to continue to generate value from the model. The initial simulation operated under the assumption that no changes would be made to the transportation network to show a worst-case scenario. The engineering firm would use the results of the model along with their own analysis to propose specific changes to alleviate the impending congestion. These improvements could be infrastructure related such as better dedicated bike lanes and intersection redesigns, supply related such as increased public transit frequency and more shared bikes docks, or policy related such as programs inside Amazon to promote carpooling among coworkers.
Any combination of changes would have a complex ripple effect, but the MATSim-NYC model is specifically designed to be able to capture and measure how travelers change their behaviors when they are presented with a wide array of options. The engineering firm would narrow down to two or three sets of changes that produced the biggest improvements over the base case and present those to the City who would make the final decision about which one, if any, ultimately get implemented.
References
LIC Development MOU. Long Island City Development Project, Attachment A. https://d39w7f4ix9f5s9.cloudfront.net/4d/db/a54a9d6c4312bb171598d0b2134c/new-york-agreement.pdf. Accessed Nov 12.
Brian Y. He, Jinkai Zhou, Ziyi Ma, Joseph Y.J. Chow, Kaan Ozbay. Evaluation of city-scale built environment policies in New York City with an emerging-mobility-accessible synthetic population, Transportation Research Part A: Policy and Practice, https://doi.org/10.1016/j.tra.2020.10.006.*
Chow, Joseph Y.J., et al. “Multi-Agent Simulation-Based Virtual Test Bed Ecosystem: MATSim-NYC .” Tech Transfer of the Multi-Agent Virtual Testbed, C2SMART, May 2020, https://c2smart.engineering.
This article builds on previous work by the C2SMART BUILT Lab. The original full paper can be found online here.
Related Posts
Prof. Vignon Wins NSF Career Award
July 23, 2026 In July, NYU Tandon Professor Daniel Vignon,...
Read More
IEEE IV: Digital Twins for Intelligent Vehicles Symposium
June 22, 2026 Along with NYU Tandon, Rochester Institute of...
Read More
Save the Date: AI Applications in Urban Transportation Management Symposium
September 25, 2026 The New York City Department of Transportation...
Read MoreShare
Facebook
Twitter
LinkedIn
Email
Print
Reddit