Using MATSim-NYC to Optimize the Brooklyn Bus Network Redesign

The New York City bus system has been experiencing a crisis since even before the COVID-19 pandemic as, over the course of the preceding decade, ridership dropped precipitously: roughly 20% in Brooklyn, and Manhattan as seen in Figure 1. 

In order to get around, these lost riders shifted to mobility modes without adequate revenue generation, straining an already very tight budget. This creates a vicious cycle where trips utilizing other transportation modes increase congestion, slowing bus service, which in turn pushes 

Chart of declining bus ridership across New York City.
Figure 1: NYC Bus Ridership, 2007-2017 (Goldwyn and Levy, 2020).

more riders off buses and into congestion-generating transportation methods. 

In 2020, Drs. Goldwyn and Levy at the NYU Marron Institute of Urban Management released “Rebuilding Bus Ridership In America,” a study which proposed several systemic changes to the bus network in order to improve the level of service for the users as well as reduce the operating costs for the MTA. The three major prongs of the plan include: infrastructure changes to favor buses over cars and trucks, route redesigns to direct buses more strategically and places stops farther apart, and increased bus frequency and consistency.  

While these changes are all expected to bring improvements, it is vital that city planners are able to quantify the scope of change impact, and in predict ripple effects as the bus system interacts with other transportations systems. To help accomplish this, the BUILT Lab at C2SMART simulated the proposed network redesign inside their MATSim-NYC model. MATSim-NYC is a virtual testbed which digitally recreates the relevant aspects New York City: the population, the road network, and the transit infrastructure. It can be thought of as a sort of “digital city,” populated by a synthetic population of travelers exhibiting realistic behaviors—each with a home, a job, errands, socio-economic status, and many other attributes which inform the choices that the traveler will make throughout the day. 

At the end of each day, the model looks at the choices every traveler made and updates them with the experiences the traveler actually had. For example, a driver who took a very congested route on day 1 will look for a different route on day 2, much like real-world drivers do. This process is repeated until the measured system improvements drop below a certain impact threshold.

“Bus network redesigns will impact travelers’ mode, route, and departure time choices,” says C2SMART Deputy Director Joseph Chow; the synthetic population in MATSim-NYC allows simulations to incorporate potential impacts on all of these to generate optimally designed transit routes. To do this, the C2SMART team “developed a tool that integrates with MATSim-NYC to evaluate the NYU Marron Institute proposal.”

In all, three scenarios were studied: (1) a baseline Brooklyn network before any changes, (2) the Marron Institute’s proposed changes, and (3) the Marron Institute’s proposed changes with the additional optimization.

The results of these studies were very promising:

  • The Marron Institute’s proposed changed increased ridership by 23% over the baseline while decreasing operating costs by 6%, leading to a farebox recovery ratio (the percentage of total operating costs that is paid for by riders) increase from .22 to .29. These values are in line with the Marron Institute’s own assessments.
  • Scenario 3, which included both the Marron Institute’s proposal and additional optimization, showed a reduction in operation costs by 25% while maintaining almost all the ridership gains leading to a farebox recovery ratio of .35—a 60% improvement over the baseline ratio. The model also indicated that nearly 75% of the trips which switched to the bus came from passenger cars, providing tremendous benefits to the entire network.

The team concluded the project by making the tool used to automate the frequency optimization algorithm inside of MATSim, the tool used to create the transit schedule and operation files (known as General Transit Feed Specification or GTFS) from the network shapefile and frequency data, and both proposed version of bus network upgrades, open-source so that future work may build on these findings.

Says Chow on the future of MATSim’s ability to help improve New York City’s transportation networks: “Further work can be done toward equity analysis within transportation networks, such as identifying individuals from our NYC synthetic population belonging to vulnerable sub-groups, like seniors, to understand their mobility options and mode usage. This open-source tool can be used to evaluate other MATSim-embedded transit network design efforts, at low cost in NYC—including post-pandemic network designs, electric bus fleets, last mile microtransit, and redesigns addressing equity.”

References
Chow, J.Y.J., Ozbay, K., He, B.Y., Zhou, J., Ma, Z., Lee, M., Wang, D., Sha, D. (2020a). Multi-agent simulation-based
virtual test bed ecosystem: MATSim-NYC. C2SMART Final Report.

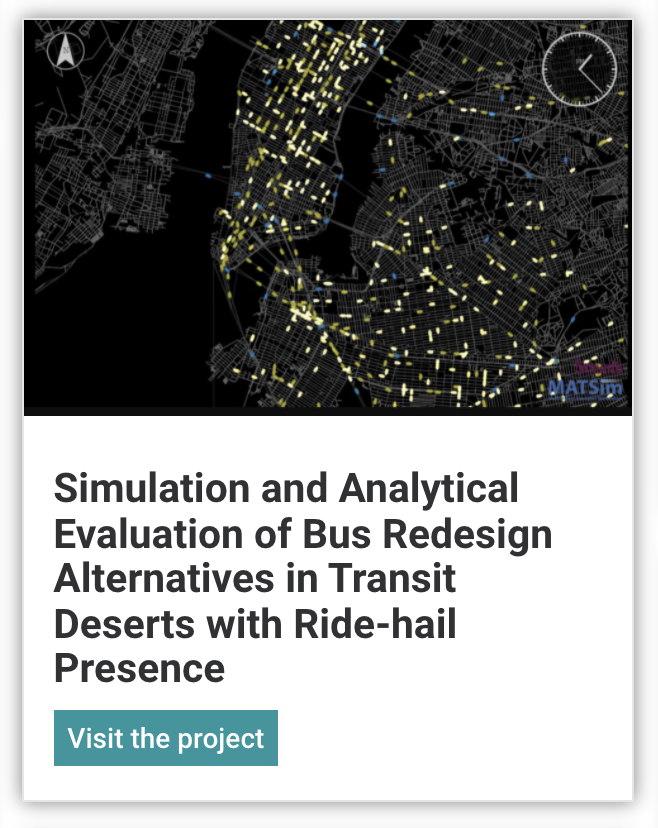
Chow, J.Y.J., Ma, Z., Lee, M., Goldwyn, E. (2020). Evaluation of Bus Redesign Alternatives in Transit Deserts under Ride-Hail Presence. C2SMART Final Report.

Goldwyn, E., Levy, A. (2020). Rebuilding bus ridership in America: A case study in Brooklyn, New York. Marron
Institute Report.

Levy, A., & Goldwyn, E. 2018. Get on the Bus: A Radical Plan for Brooklyn’s Bus Network. New York Magazine.

Ma, Z., & Chow, J. Y. (2021). Transit Network Frequency Setting With Multi-Agent Simulation to Capture Acitivty-Based Mode Substitution . Transportation Research Record, 1-17.

Marcotte, P. (1986). Network design problem with congestion effects: A case of bilevel programming. Mathematical Programming: Series A and B.

Related Posts

Share

Facebook
Twitter
LinkedIn
Email
Print
Reddit